Getting Started - Prepare Your Environment ## Exercise 1 - Accessing your Kubernetes Cluster ## Exercise 2 - Installing Istio ## Exercise 3 - Deploy Guestbook with Istio Proxy ## Exercise 4 - Expose the service mesh with the Istio Ingress Gateway ## Exercise 5 - Telemetry ## Exercise 6 - Traffic Management ## Exercise 7 - Security —
Exercise 5 - Observe service telemetry: metrics and tracing
Challenges with microservices
We all know that microservice architecture is the perfect fit for cloud native applications and it increases the delivery velocities greatly. Envision you have many microservices that are delivered by multiple teams, how do you observe the the overall platform and each of the service to find out exactly what is going on with each of the services? When something goes wrong, how do you know which service or which communication among the few services are causing the problem?
Istio telemetry
Istio’s tracing and metrics features are designed to provide broad and granular insight into the health of all services. Istio’s role as a service mesh makes it the ideal data source for observability information, particularly in a microservices environment. As requests pass through multiple services, identifying performance bottlenecks becomes increasingly difficult using traditional debugging techniques. Distributed tracing provides a holistic view of requests transiting through multiple services, allowing for immediate identification of latency issues. With Istio, distributed tracing comes by default. This will expose latency, retry, and failure information for each hop in a request.
You can read more about how Istio mixer enables telemetry reporting.
Configure Istio to receive telemetry data
-
Verify that the Grafana, Prometheus, Kiali and Jaeger add-ons were installed successfully. All add-ons are installed into the
istio-systemnamespace.kubectl get pods -n istio-system kubectl get services -n istio-system -
Obtain the guestbook endpoint to access the guestbook.
The endpoint is the NLB host name ($NLB_HOSTNAME) from the previous lab. This is the command to list the address, watch out for the correct one, there should be two addresses, it is most likely the second with the Health Monitor enabled:
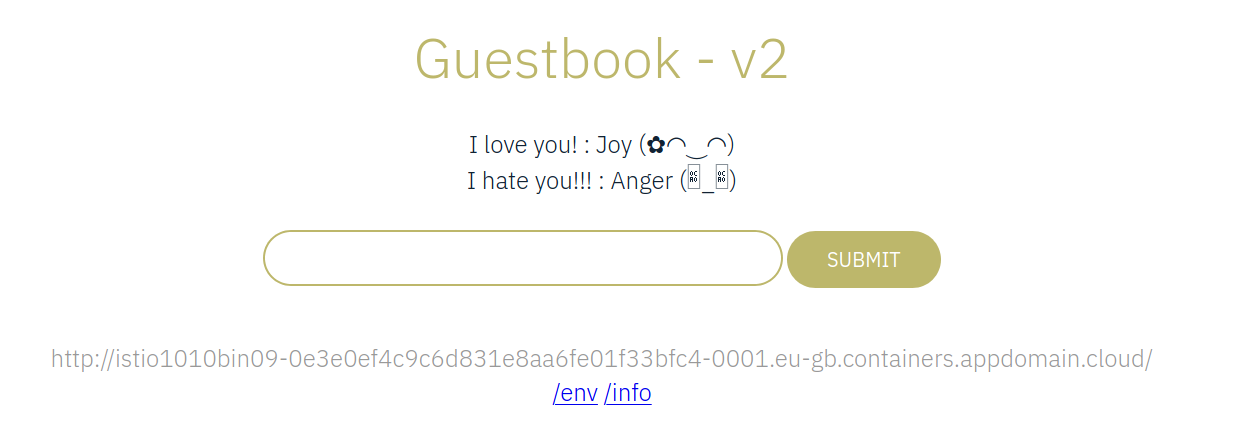
ibmcloud ks nlb-dnss --cluster $MYCLUSTERGo to this URL in the browser to try out your guestbook. This service will route you to either v1 or v2, at random. If you wish to see a different version, you’ll need to do a hard refresh (
cmd + shift + ron a mac, orctrl + f5on a PC).Enter some text in V1 (blue) and some more text in V2 (yellow). Notice that V2 adds tone information to your input.
Alternatively, you can
curlthe address.
-
Generate a small load to the app:
for i in {1..20}; do sleep 0.5; curl http://$NLB_HOSTNAME/; done
View guestbook telemetry data
In the previous lab we exposed the Istio Ingressgateway with the help of a Network Load Balancer (NLB) which gave us a URL ($NLB_HOSTNAME) to access the Guestbook app. In this section we use the instructions provided on the Istio homepage to remotely access the telemetry addons like Grafana, Prometheus, and Kiali.
Grafana
-
Make sure you are in directory ‘/istio101/workshop/plans’, then expose Grafana:
kubectl apply -f grafana-gateway.yaml -
In your browser open the $NLB_HOSTNAME URL but add port 15031, e.g.:
http://istio1010bin09-0e3e0ef4c9c6d831e8aa6fe01f33bfc4-0001.eu-gb.containers.appdomain.cloud:15031 -
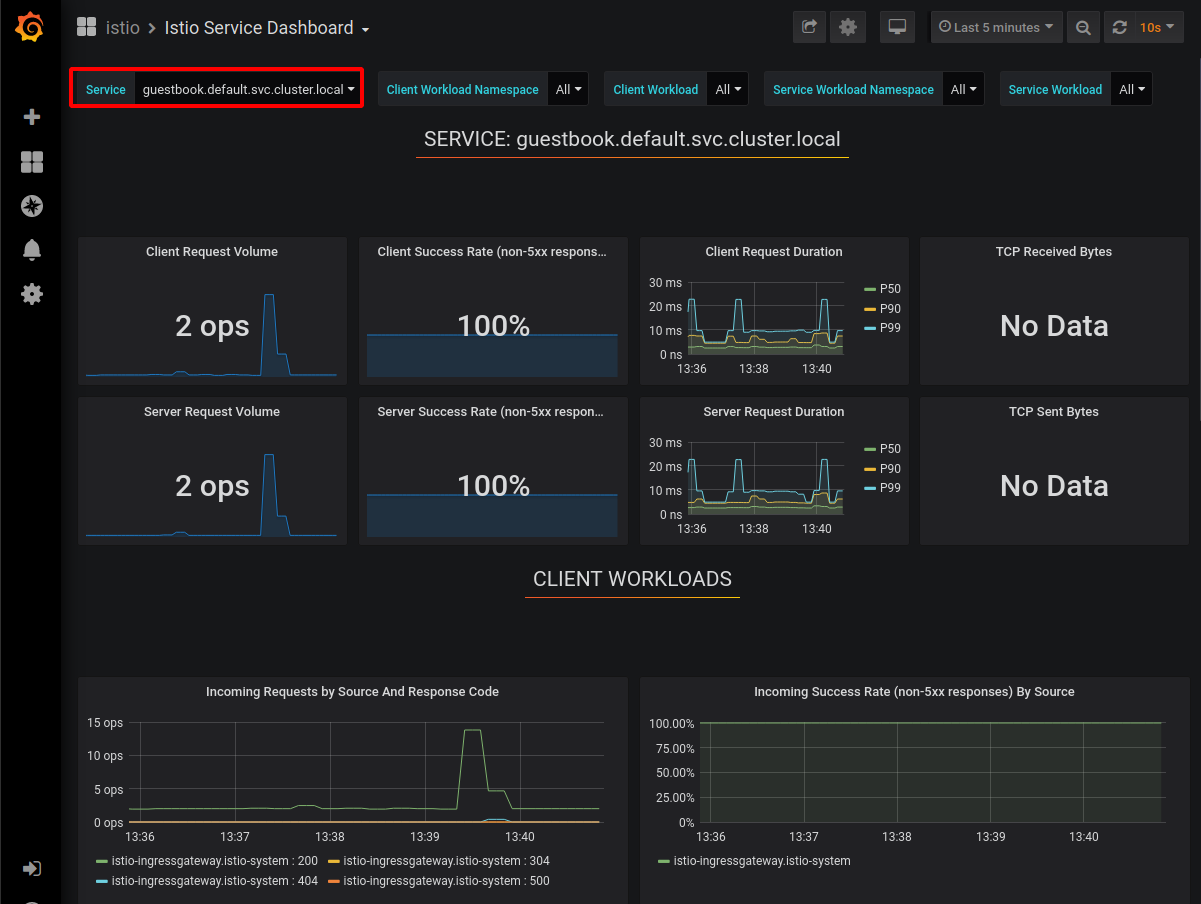
Click on Home -> Istio -> Istio Service Dashboard.
-
Select guestbook.default… in the Service drop down.
-
In a different tab, visit the guestbook application and refresh the page multiple times to generate some load.

This Grafana dashboard provides metrics for each workload. Explore the other dashboard provided as well.
Prometheus
-
Make sure you are in directory ‘/istio101/workshop/plans’, then expose Prometheus:
kubectl apply -f prometheus-gateway.yaml -
In your browser open the $NLB_HOSTNAME URL but add port 15030, e.g.:
http://istio1010bin09-0e3e0ef4c9c6d831e8aa6fe01f33bfc4-0001.eu-gb.containers.appdomain.cloud:15030 -
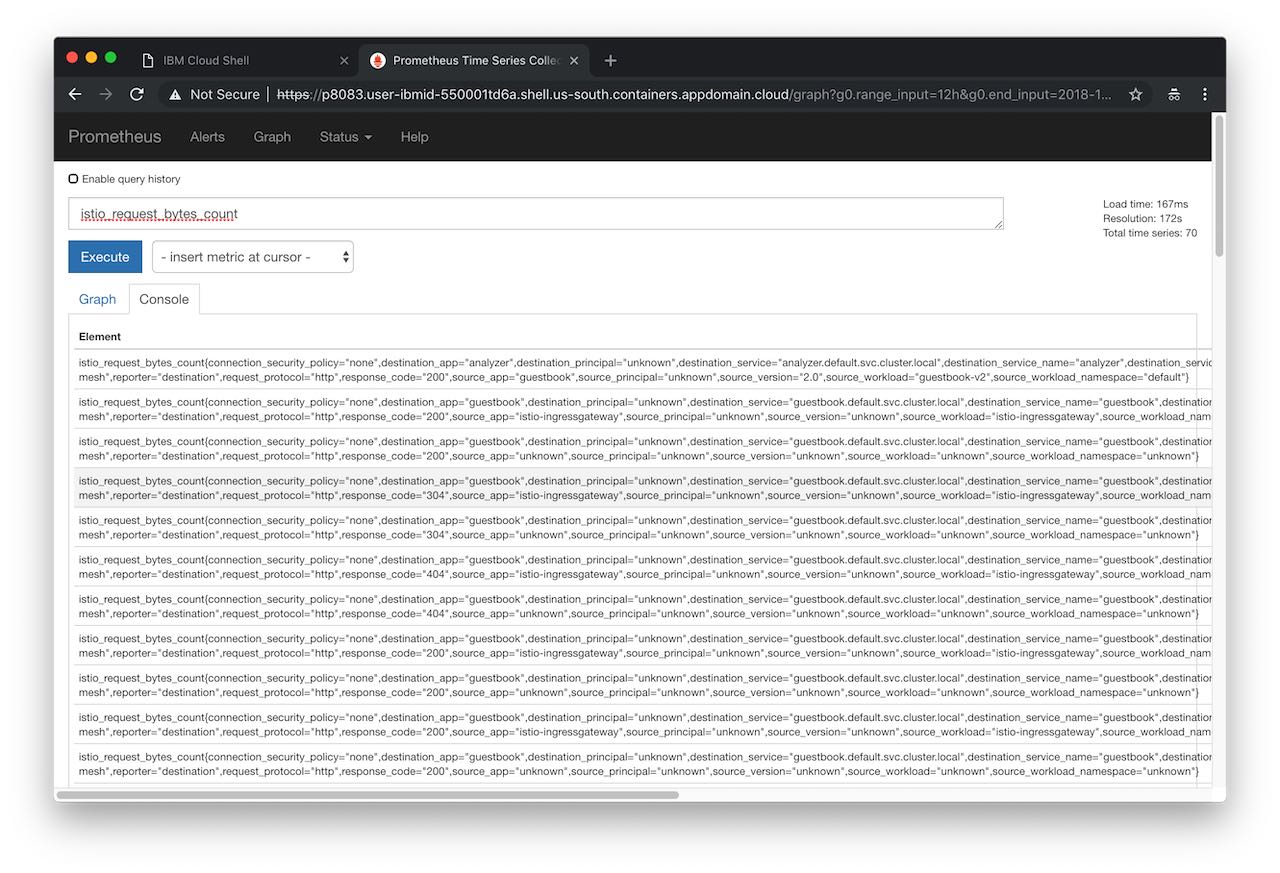
In the “Expression” input box, enter:
istio_request_bytes_count. Click Execute. -
Then try another query:
istio_requests_total{destination_service="guestbook.default.svc.cluster.local", destination_version="2.0"}
-
Explore the Graph tab as well.
Kiali
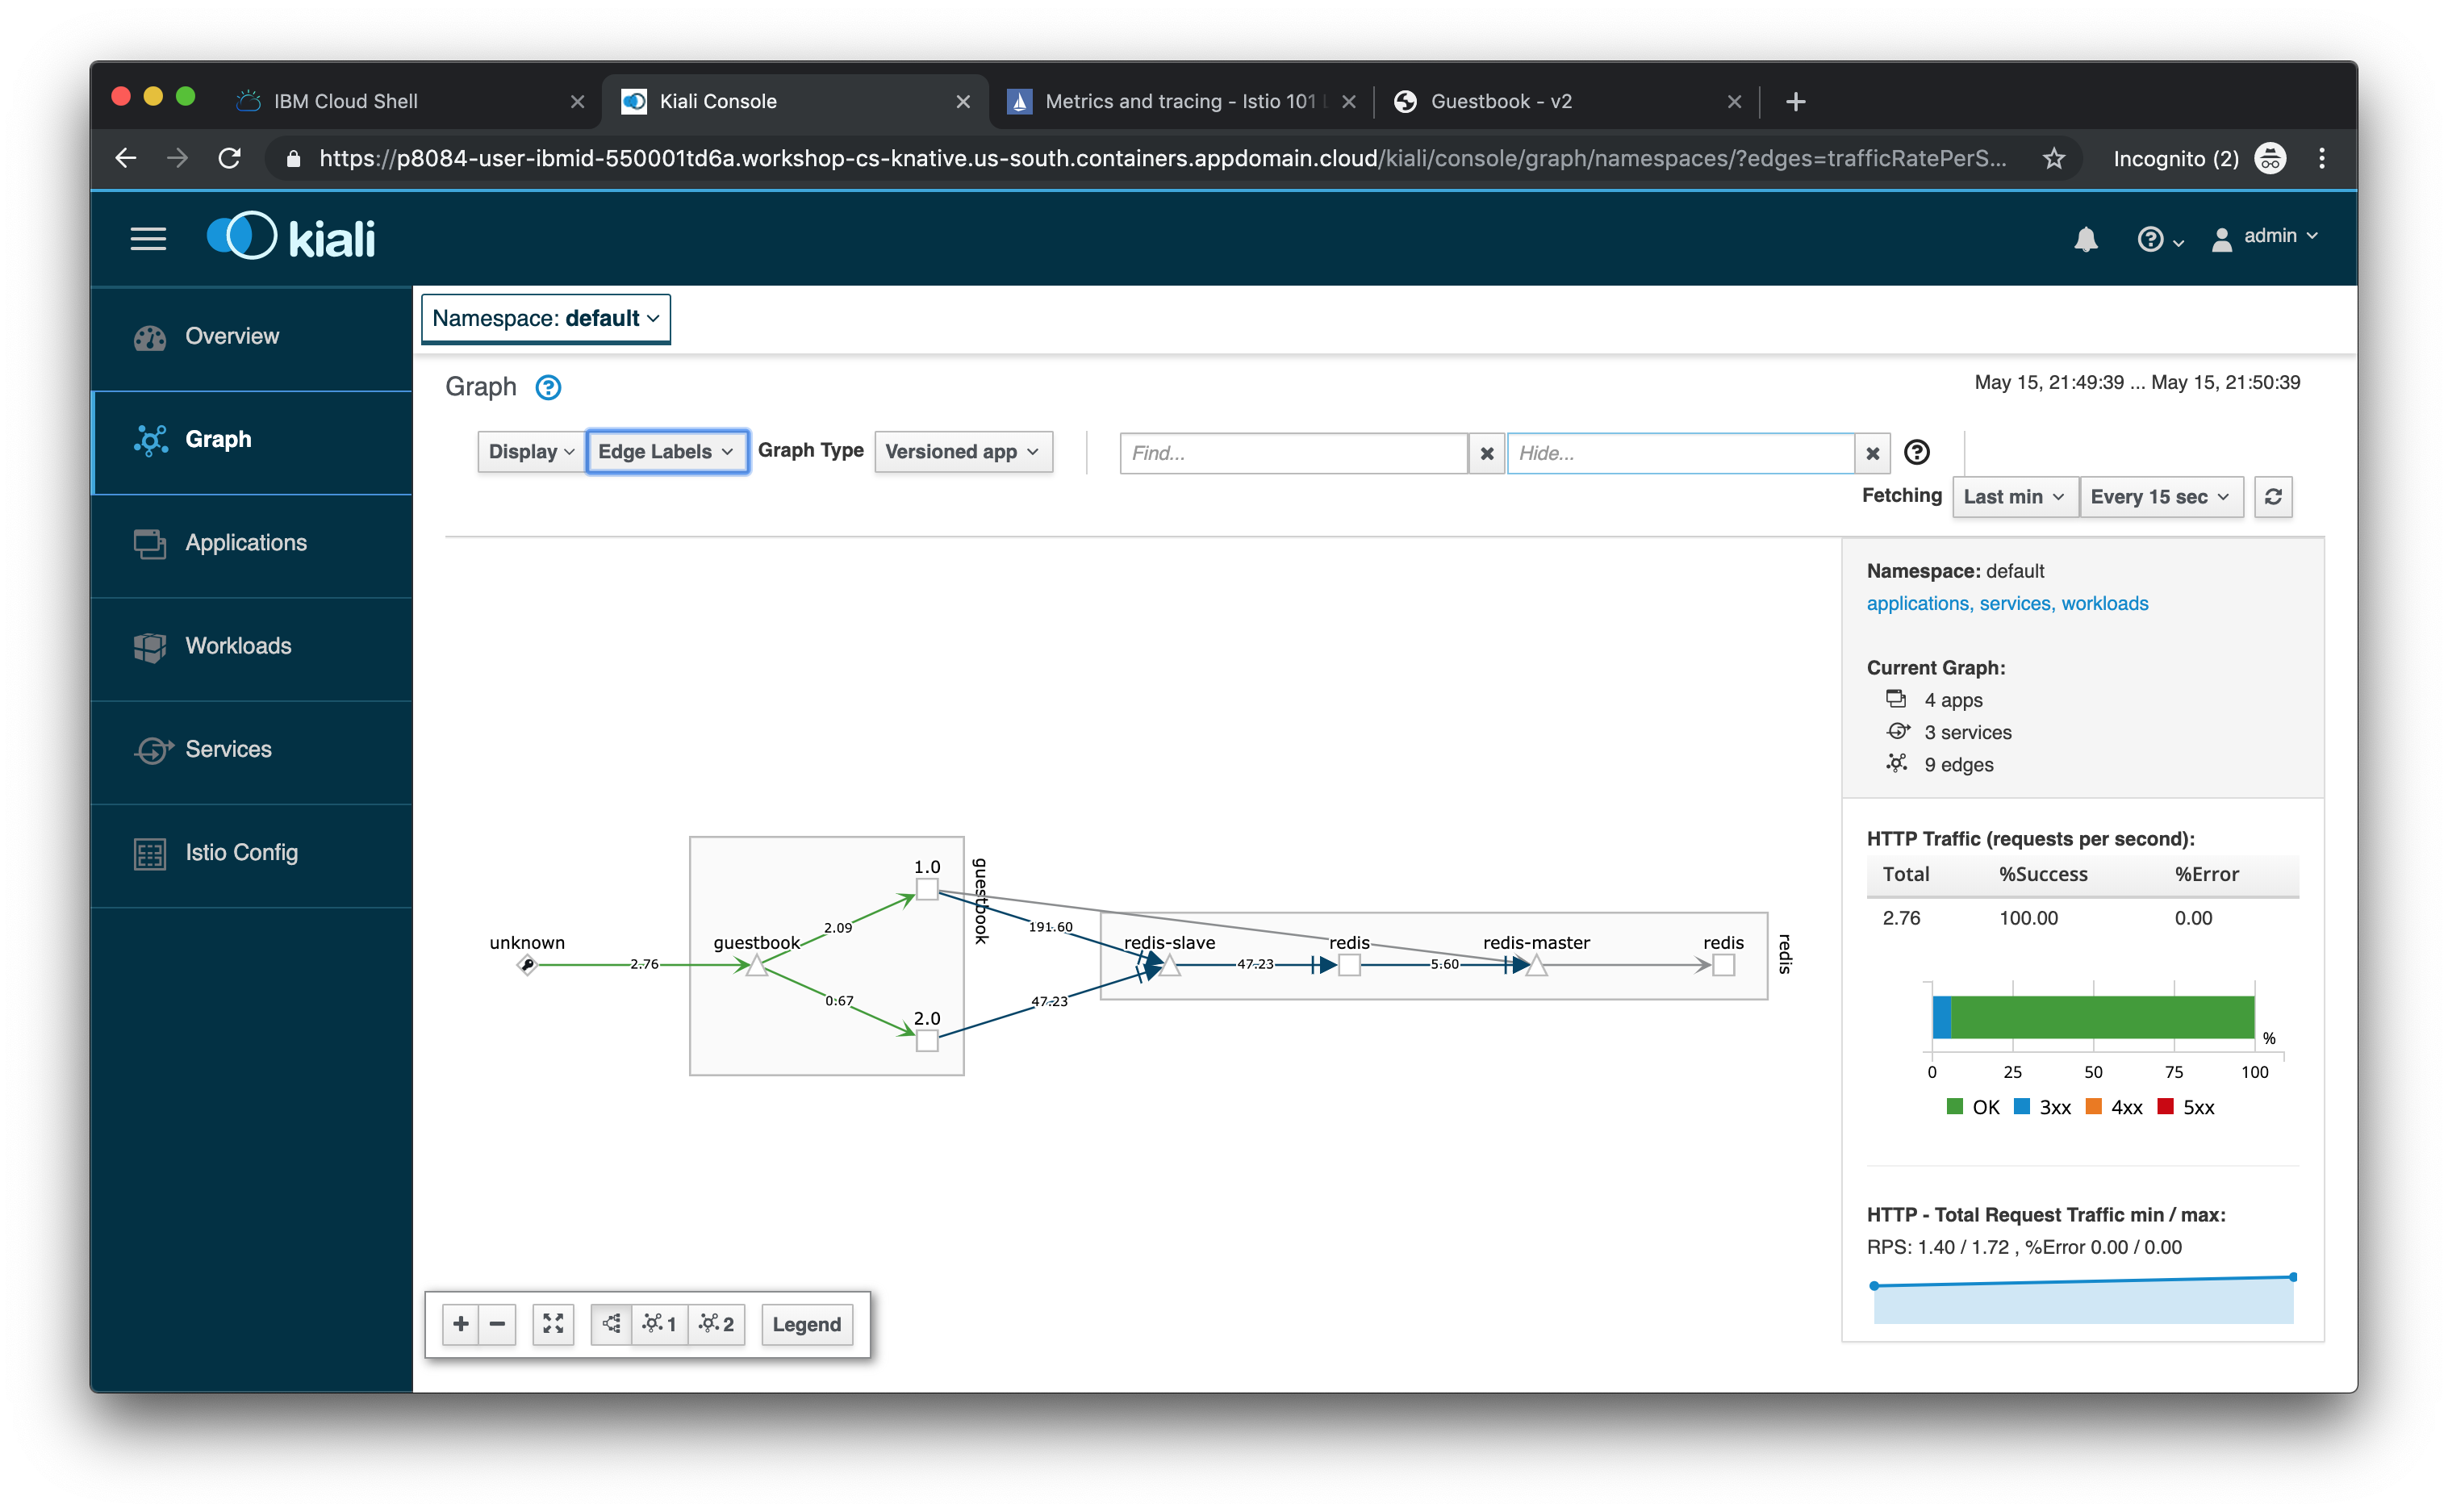
Kiali is an open-source project that installs as an add-on on top of Istio to visualize your service mesh. It provides deeper insight into how your microservices interact with one another, and provides features such as circuit breakers and request rates for your services.
-
Create a secret which will be used to set the login credentials for Kiali (file can be found in /istio101/workshop/plans/)
kubectl create -f kiali-secret.yaml
-
Now expose Kiali:
kubectl apply -f kiali-gateway.yaml -
In your browser open the $NLB_HOSTNAME URL but add port 15029, e.g.:
http://istio1010bin09-0e3e0ef4c9c6d831e8aa6fe01f33bfc4-0001.eu-gb.containers.appdomain.cloud:15029The Login dialog may tell you that the Kiali secret is missing, but we just created it.
-
Login with the following username/password:
admin/admin. -
Click the “Graph” tab on the left side and select the default namespace to see the a visual service graph of the various services in your Istio mesh. You can see request rates as well by clicking the “Edge Labels” tab and choosing “Traffic rate per second”.
-
In a different tab, visit the guestbook application and refresh the page multiple times to generate some load.
Kiali has a number of views to help you visualize your services. Click through the various tabs to explore the service graph, and the various views for workloads, applications and services.

Keep the Kiali dashboard open for the next lab.